New job, new firm but the same Free Whelan. Thank you for your continued support and keep unlocking valuable insights into the global market every week with me!
Good afternoon,
I'm keen to announce that we are so back.
By that, I mean that my weekly note is so back after a hiatus over the long break. And, whilst I am always logged in and contactable, it's good to do that from somewhere with fresh green king prawns off the back of the fishing boat and beef in the evening. Speaking of which, here is the annual shot of one of our newest members to the farm.

Bullish (ha)
But there's another reason I post this and it's to show you (proudly) how green and thick the grass is in East Gippsland. Driving back and forth to Sydney you notice that the situation is the same everywhere.
Which is great. What's not great is talking to the farmers down there (as is my job to do) you hear that same frustration at the number of financial decisions that were made in 2023 based on the forecasts and predictions by our Bureau of Meteorology.
Remember the prediction was for El Nino to kick in and for the drought to start fairly soon. (I'm paraphrasing I apologise)
Decisions were made and they have been early.
I'd like to see an inquiry made into the decision that was made to see if it was 100% made based on the data. If so, that's worth further investigation. If not...well you see where I'm going here. Either way, people are a little upset that the source they rely on was so wrong at such a vital time.
How vital?
Australia is caught in some bizarre war against the supermarket giants regarding the price of food. There are financial commentators and politicians out there saying Woolies is making too much from food and that's impacting what we pay in store. In fact, Woolworths' margin on food is about 2.5%.
Interactions like this kept me company in early January.
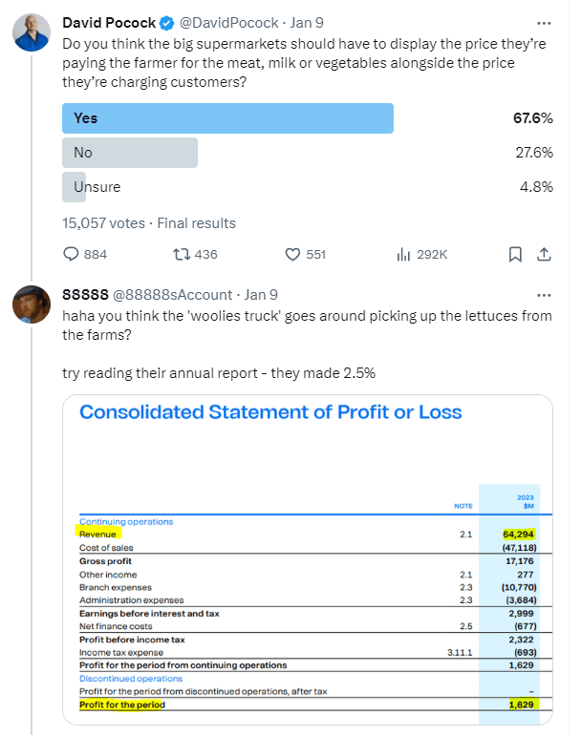
Source: David Pocock - X
Lotta folks became experts on food logistics and profit margins. Which is a change from geopolitical experts and before that infectious disease experts.
This chart doesn't lie. It's scary and was posted by the always excellent CBA Head of Aussie Economics Gareth Aird.
Food costs as they are...that blue line...I think there are more rate cuts this year than priced in.
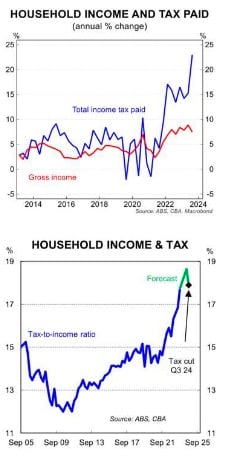
Source: ABS CBA
EM Call
In our daily note last week I put in the case for China equities with an ETF to match it. CETF by Van Eck to be exact. I think the flows are there. Not to go over it again but the risk/reward for China exposure was too good to ignore.
Here's a link to our report that day with my part at the bottom explaining it. I still think it's worth a look.
Speaking more broadly on EM and late last week two charts sing straight out of my psalm book.
Cheap and strong flows? Yes, please.
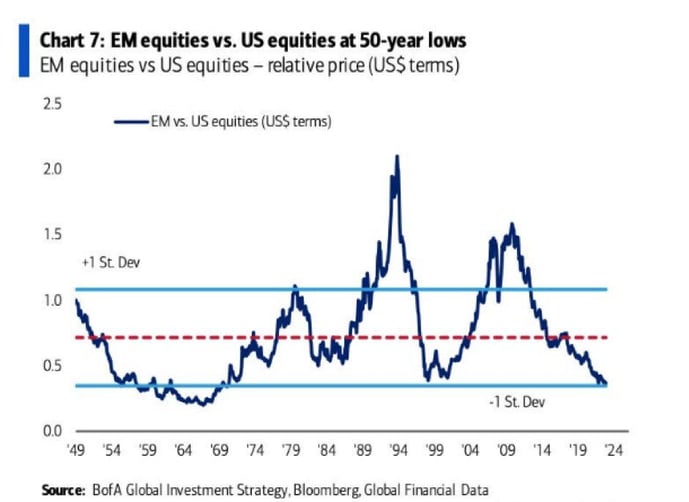
Source: BofA Global Investment Strategy, Bloomberg, Global Financial Data
and
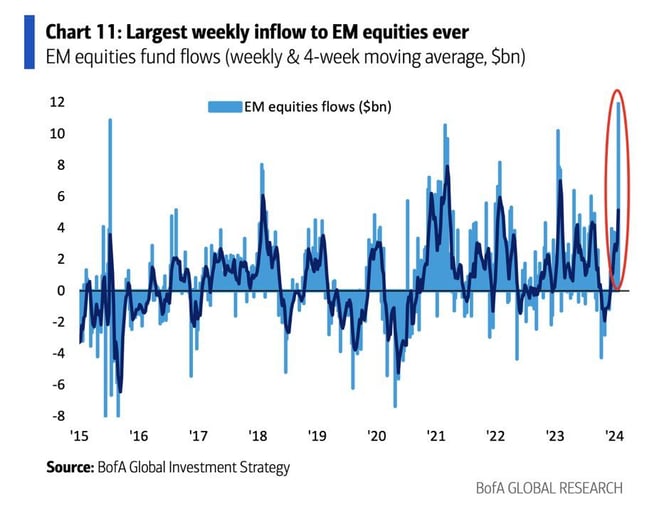
Source: BofA Global Investment Strategy, Bloomberg, Global Financial Data
Don't fight the flows.
Finally, this happened. Bitcoin was finally approved to be in an ETF so everyone thought this was going to up the flows into the original coin. Offsetting this is the chatter that The FTX estate dumped around a billion dollars of BTC and a total of just over 3 billion has been sold. So, with a little mangling and some chatter, a big proportion of outflows have been based on FTX. That being said, Bitcoin is back to about where it was pre-SEC announcement so the selling has been there but the buying has offset a little.
It's really just been an already priced-in transfer from an expensive structure (Greyscale) to cheaper new ones with the added bonus of forced liquidation.
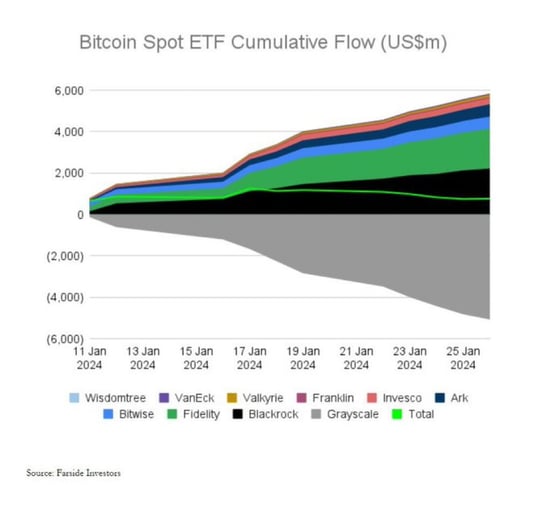
Source: Farside Investor
Stay safe and all the best,
James