Every Tuesday afternoon we publish a collection of topics and give our expert opinion about the Equity Markets.

One of the goals for ABSI is to dive into important financial news stories that don’t get enough emphasis due to a myriad of reasons. One of those reasons is the technicality of the topic and the difficulty in simplifying difficult topics. With that being said, an important story you may have missed last week was the US held an auction for 30-year bonds which produced underwhelming demand and showed cracks of concern with US government debt levels. ABSI this week will explain the auction process and the metrics to pay attention to.
It is a fairly well-known fact that the US has extremely high government debt levels at US$33.7 trillion (as of 9th Nov 2023) and with the federal government running a ~US$1.7 trillion deficit in FY23, there is a need to continue raising funds.
But exactly how does the US government raise money?
Contrary to popular belief, the money doesn’t just magically appear from the Federal Treasury by inputting some numbers in a computer. Instead, the Treasury regularly conducts an auction to issue US government debt, of varying maturities, to market participants. These participants include banks, pension and endowment funds, other countries, and individuals.
Before diving into the results of the most recent issue, it is important to appreciate the auction process. In a US Treasury auction, there are two types of bids: 1) competitive, whereby the bidder specifies an explicit yield (interest rate), and non-competitive, whereby the bidder accepts the rate determined by the auction and the order is guaranteed to be filled. For example, the Treasury may want to issue $1 billion in 2-year Notes (US slang for a short-duration bond) with a 5% coupon rate (also known as WI). If non-competitive bids come in at $500m then a “Dutch auction” commences with the competitive bids starting at the lowest yield and moving up the ladder until another $500m is raised to complete the auction. Say the competitive bids are:
- $100m @ 4.80%
- $250m @ 4.90%
- $100m @ 5.00%
- $250m @ 5.04%
- $300m @ 5.06%
In the above situation, because only $500m is needed, the bids at 4.8%, 4.9%, and 5% will be completely filled while only $50m will get filled at 5.03%. Importantly, the last tranche filled is what sets the price, so the entire bond auction (both competitive and non-competitive) will be priced at 5.04% - this is known as the High Yield (HY).
Noteworthy, from the above example the auction High Yield (5.04%) is higher than the coupon (5%) which means the bonds will be issued at a discount to face value. This is a bad result and is what is known as a positive tail. In bond auction circles, a tail result that Treasury will aim for is a negative tail, when the yield is less than the coupon. A negative tail implies strong demand for US bonds which forces down prices (yield is inverse to price). A positive tail means there was a lack of demand and Treasury had to lower prices in order to fill the required auction. In the above example, the tail was 4 bps negative; any result 4 bps or higher is considered disastrous by bond investors. (BTC), which is the total amount of bids divided by the raise amount. A BTC above 1 indicates that there was more demand for the bonds than supply, while a number less than 1 means auction failure as there wasn’t enough demand to fill supply. For the record, the BTC is usually above 2 and, to my knowledge, a BTC below 1 has never occurred to the US as there are primary dealers (aka big banks) who effectively underwrite the offer. If it ever did happen, the Federal Reserve could always step in to replace vacant demand but that’s a slippery slope to becoming the Bank of Japan.
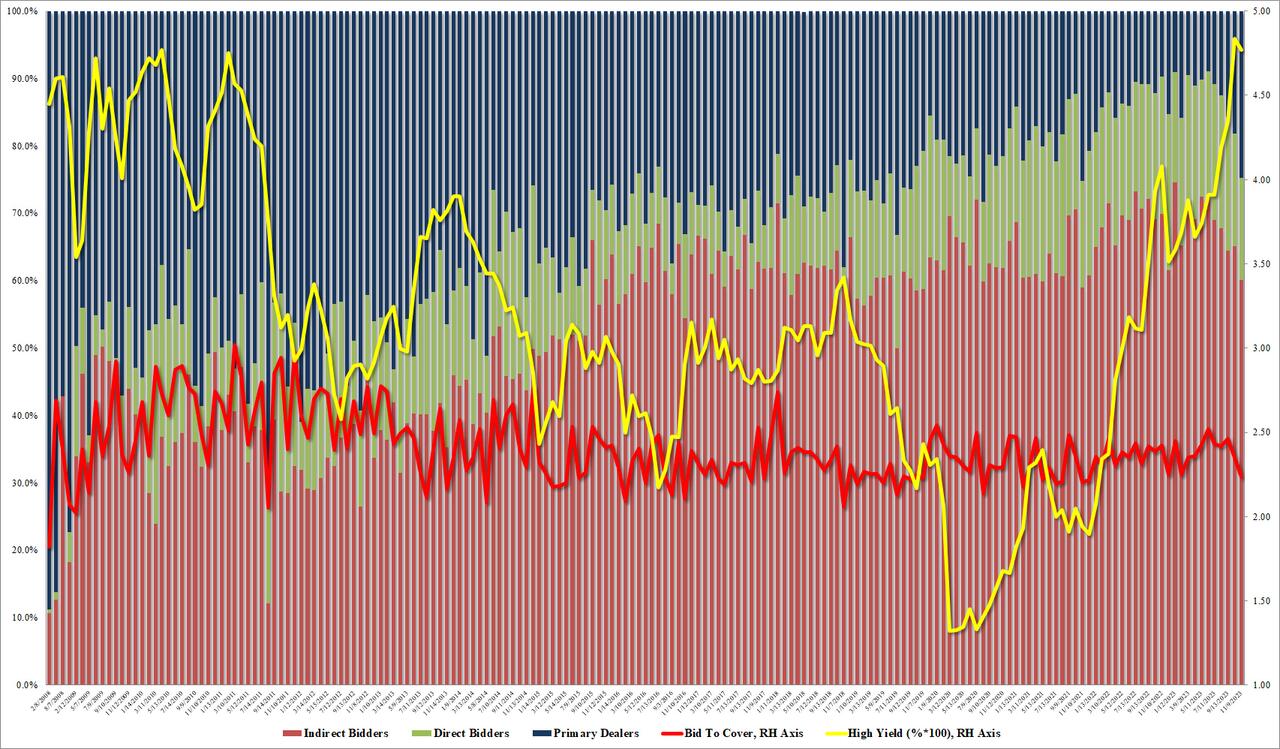
Source: Zero Hedge
Last Thursday, the US Treasury held a US$24 billion auction of 30-year bonds, which has been described as a complete disaster; the reasons for which are wide-ranging. Firstly, the demand lacked with BTC ratio of 2.24 versus a 6-year avg. of 2.44. The primary result for the lower BTC was due to below-average demand from foreign buyers. Using the 6-year average, Indirects (foreigners) take up 68.6% while Directs (domestic) average 18.6%, and the Dealers (underwriters) pick up the residual 12.7%. However, in the most recent auction Indirects fell to 60.11%, Directs fell to 15.16%, forcing Dealers to pick up 24.73% of the offer.
Source: Zero Hedge
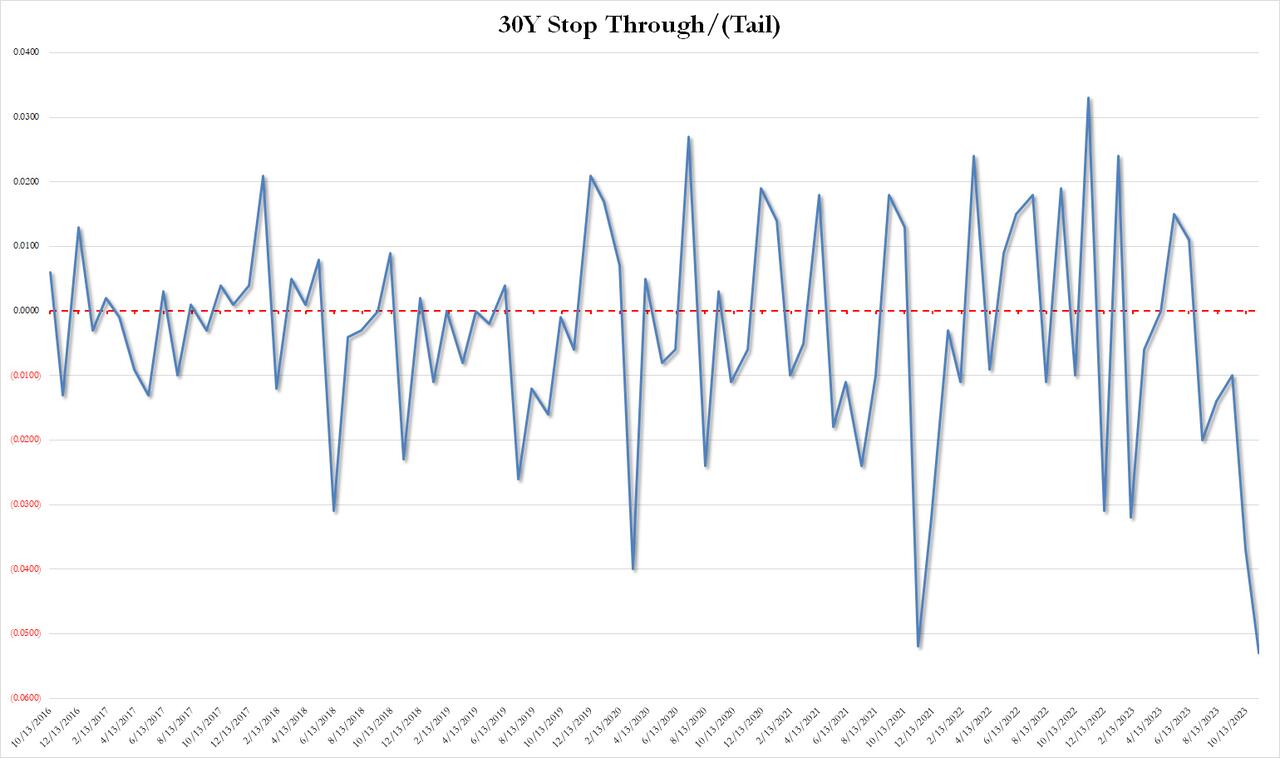
Looking at other elements, the WI prior to the auction was 4.716% while the auction HY registered at 4.769%, giving the auction a positive tail of 5.3 bps. Records only go back to 2016, but this was the worst tail on record and well above the 6-year average tail of 0.9 bps. It is also indicative of a negative trend of worsening tails.
So what does this all mean?
In short, not much but everything at the same. The US Treasury runs auctions regularly given the US debt levels and deficits, so a single piece of auction data is not hugely relevant. However, a negative trend is starting to form which is exposing small cracks in the market's assessment of the US financial system. Unless the Federal deficit is reigned in, I’d expect to see growing tails in the years ahead. Catalyst which could change the sentiment include the impending government shutdown and the 2024 presidential election.
We offer value-rich content to our BPC community of subscribers. If you're interested in the stock market, you will enjoy our exclusive mailing lists focused on all aspects of the market.
To receive our exclusive E-Newsletter, subscribe to 'As Barclay Sees It' now.


